Accessing your reports
Steps
1. Log in to your Portal
2. Go to Reports
3. Select which report you want to view

Report options
You have 5 reporting options in your portal. Below is a brief description of each one.
Accounts Receivable & Accounts Payable
Accounts Receivable are the amounts that have been paid to your business. Accounts Payable are the amounts outgoing from your business to other users who are owed money. To select one of these options click on the arrow next to their line.

The top bar represents a summary view of the number of successful transactions, average transaction amount, maximum transaction amount, and successful transaction volume.

You can see the breakdown of your receivables or payables in detail by reviewing each available graph:
- Volume
- Successful and failed transactions
- Transactions by payment methods
- Transaction amounts by payment method
Each graph has its own date range capabilities. Simply select the date range and the dates and the graph will auto-adjust to reflect the data.

If you want to apply the same date range to all the graphs, use the date range bar in the upper right corner above the summary line.

Once you have selected your date range you can also filter by available payment method. Simply select the payment method you want to view or select all if you want to view them simultaneously.

Invoices & Subscriptions
In this section, you can view:
- Total revenue earned by payment method
- Active Subscriptions
- New Subscriptions
- Outstanding Invoices
- Revenue from products
- Average Revenue
- Top Users
- Subscription Churn Rate
- Churned Revenue
Each graph has its own date range capabilities. Simply select the date range and the dates and the graph will auto-adjust to reflect the data.

If you want to apply the same date range to all the graphs, use the date range bar in the upper right corner above the summary line.

Last Day Reports
Last day reports allow you to view the summary of previous transactions in one of the following statuses:
- Completed
- Failed
- Cancelled
- Created at
You can filter the report by payment method and date by using the filters at the top of the page.

You can also download your report by clicking on the download icon in the upper right corner

Failure Reports
Failure reports allow you to view the transactions that have failed in the following formats:
- Transaction failures by payment methods
- Transaction failures detailed summary
You can filter by payment method and by date by using the filters available in each graph.
Downloading reports
On each reporting page, you have the option to download certain reports in .xlsx format. To download your report look for the download button ![]() on your graph.
on your graph.
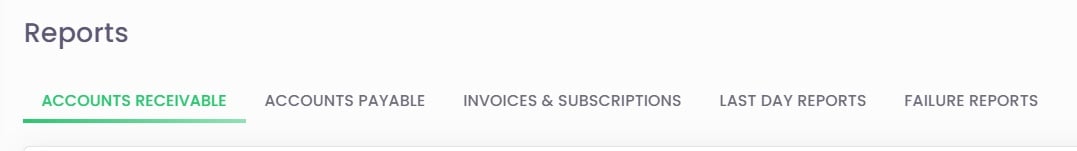
Toggling between reports
If you want to go from one report to another easily, use the tab system at the top of the page and click on the report you want to view.
